Give every number a consistent place.
Leader panels repeat a simple structure: rank, player, team, and value. Consistent alignment makes it easier to scan a category and move between categories. Player names lead directly to individual profiles.
Independent project / Sports analytics
Making a busy baseball season easier to follow.
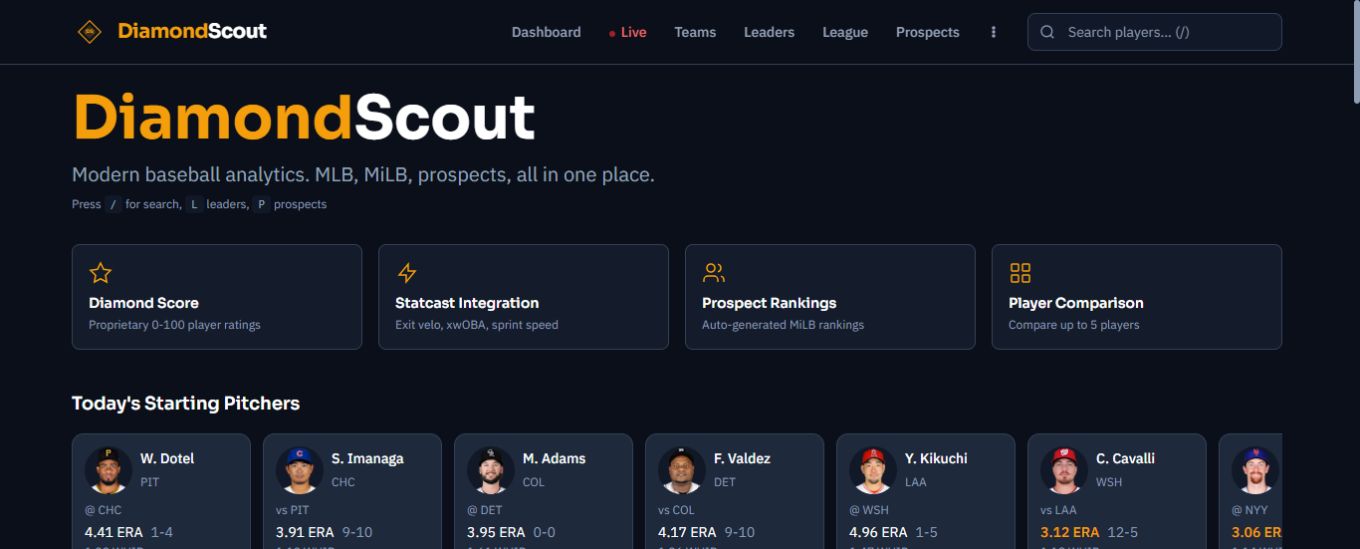
Following baseball means moving between today's games, season statistics, and longer-term player research. The interface needs to help someone find the right level of detail without losing their place in all that data.
I build DiamondScout as an independent project, bringing together my interest in baseball and my React and TypeScript work. My scope covers the frontend experience and the integration of baseball data into player, prospect, and league views.
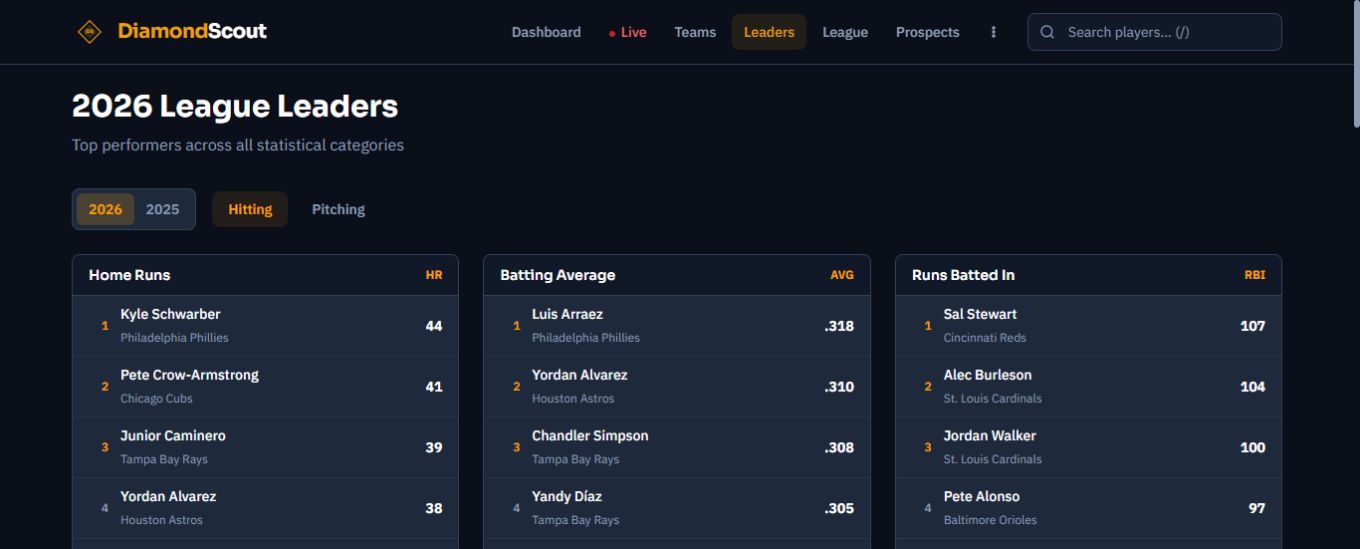
Leader panels repeat a simple structure: rank, player, team, and value. Consistent alignment makes it easier to scan a category and move between categories. Player names lead directly to individual profiles.
Season and hitting or pitching controls sit above the leader panels. Keeping those choices close to the data helps someone understand which group of players and statistics they are looking at.
Search lives in the main navigation, alongside direct routes to teams, leaders, and prospects. The interface also exposes keyboard shortcuts and search-navigation instructions for people who return frequently.
The next thing I would measure is how quickly someone can move from a player name to the statistic they need. That would give me a concrete way to evaluate the search and navigation as the product grows.
Screenshots from the live product, captured September 11, 2026. Product screens and data may change.